The last post explained why Projet 4C exists. This one shows what it actually looks like.
What it’s built to do
Projet 4C has one job: take the friction out of splitting shared expenses as a couple.
Every month, my girlfriend and I each upload the CSV export from our credit cards. The tool ingests them, categorizes each transaction automatically, separates shared spending from personal spending, and tells us who owes who — and how much.
No more going through transactions one by one. No more manual Google Sheet. Just upload, review, settle up.
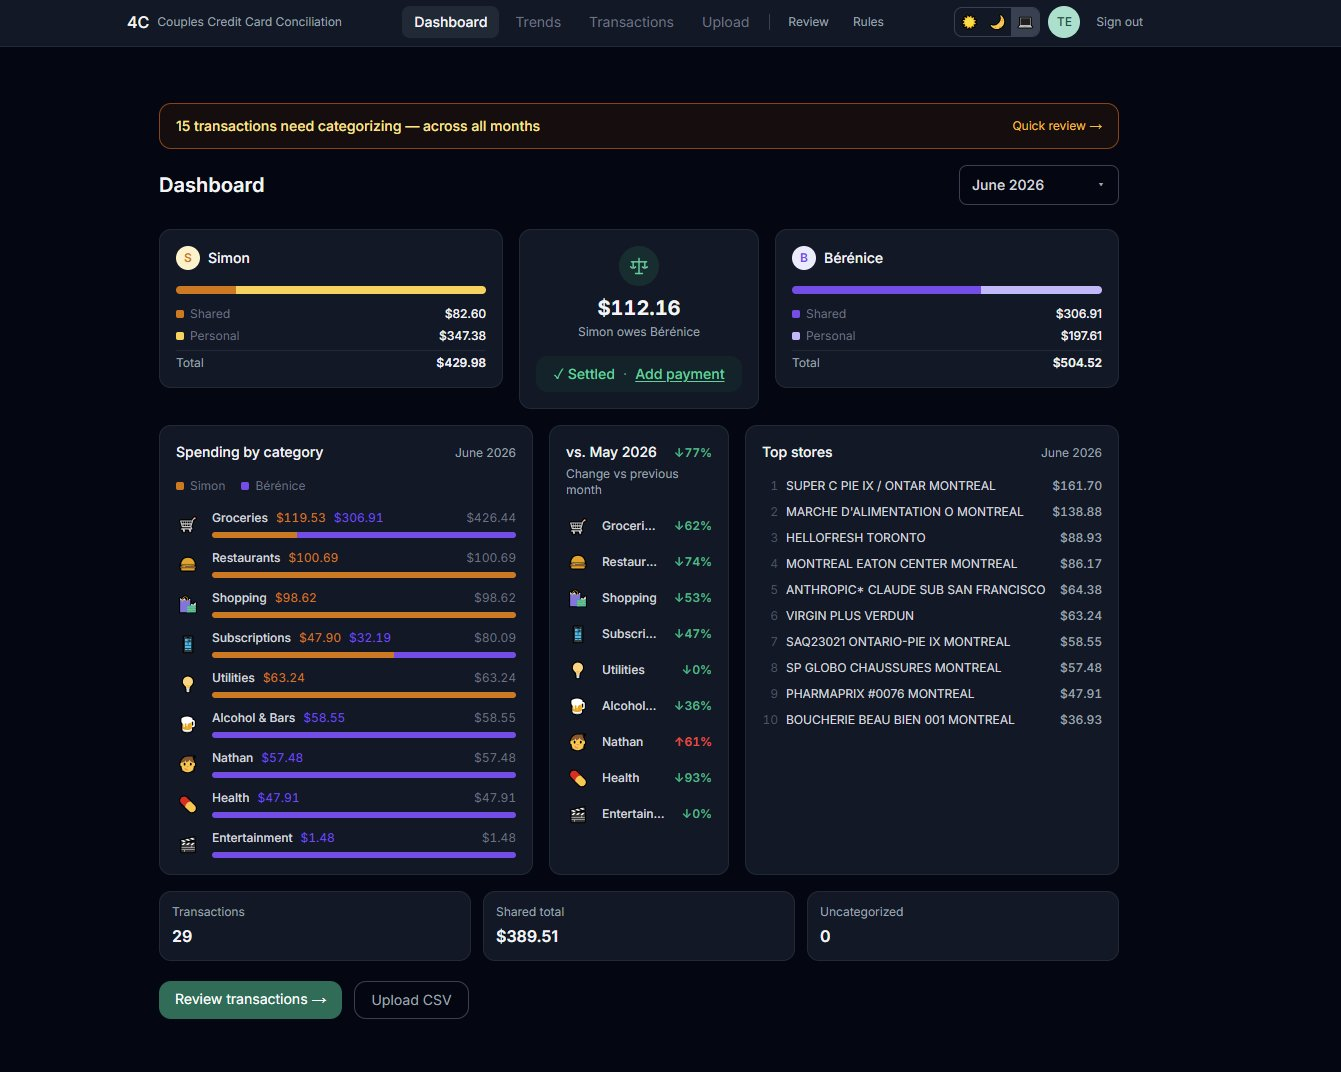
The dashboard
The first thing you see when you open 4C is the dashboard. At a glance: each person’s total spending broken down between shared and personal, and the settlement amount in the middle — who owes who and how much. Below that, spending by category for both people side by side, a comparison vs. the previous month, and a top stores list.
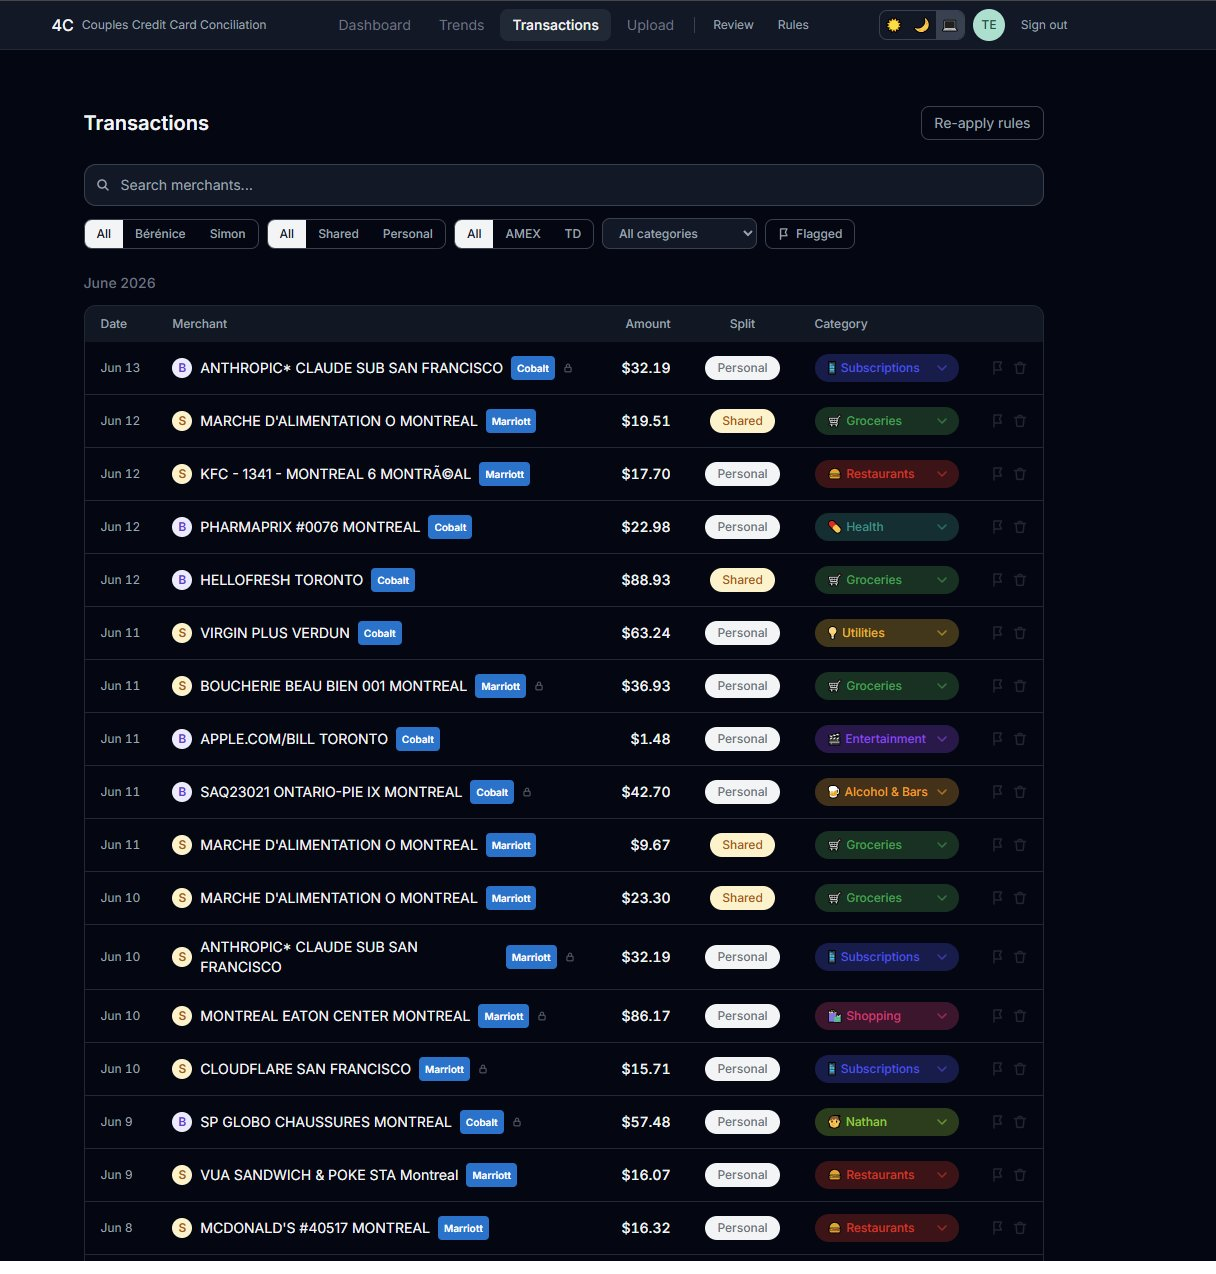
The transactions view
Every transaction is listed with its date, merchant, card, amount, split type (shared or personal), and category. Everything is filterable — by person, card, split type, or category. You can also override anything the auto-categorization got wrong directly inline.
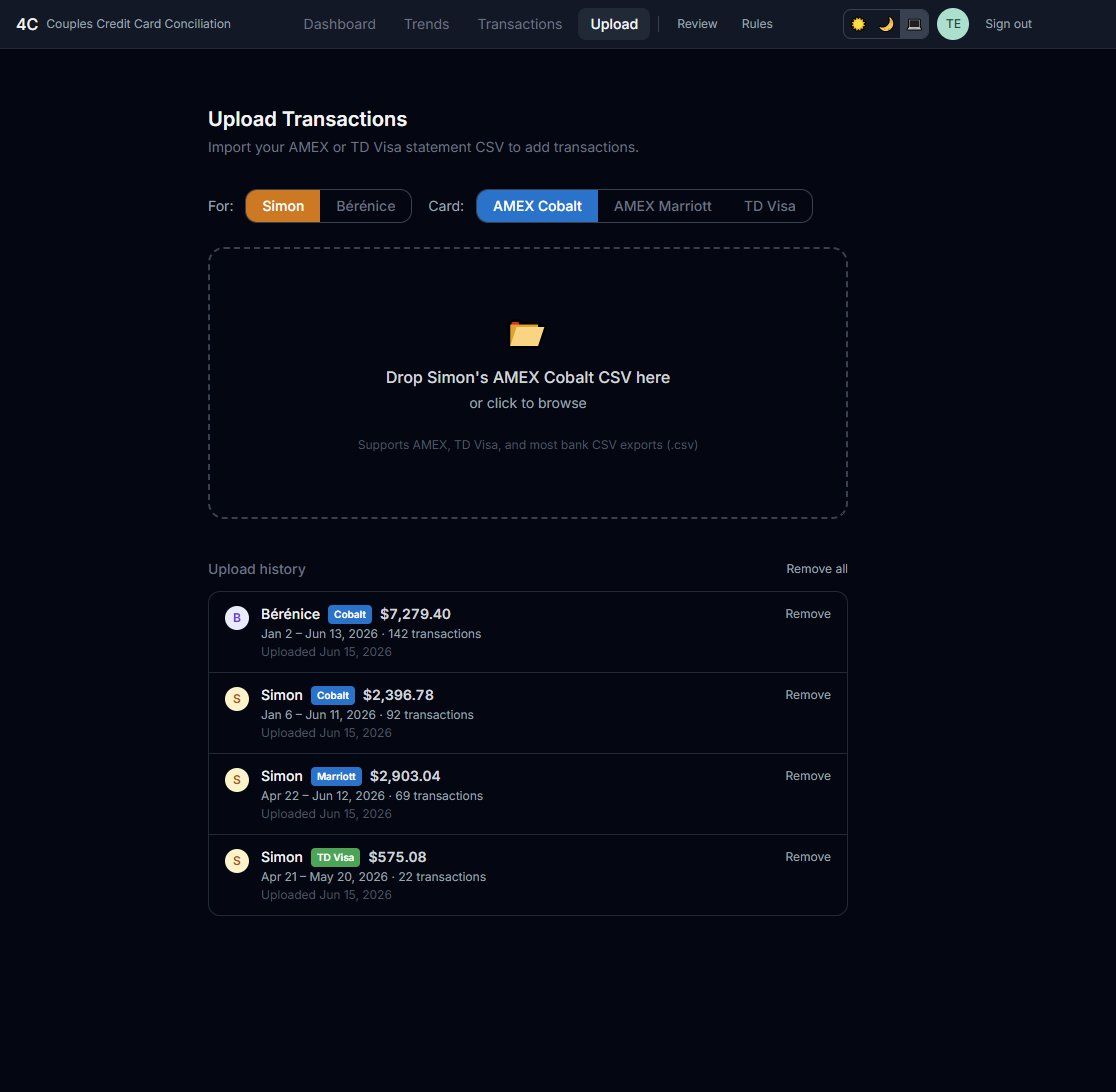
The upload screen
Each month, we each download the CSV from our bank and drag it in. The tool handles the parsing, deduplication, and categorization automatically. The upload history keeps track of what’s already been imported.
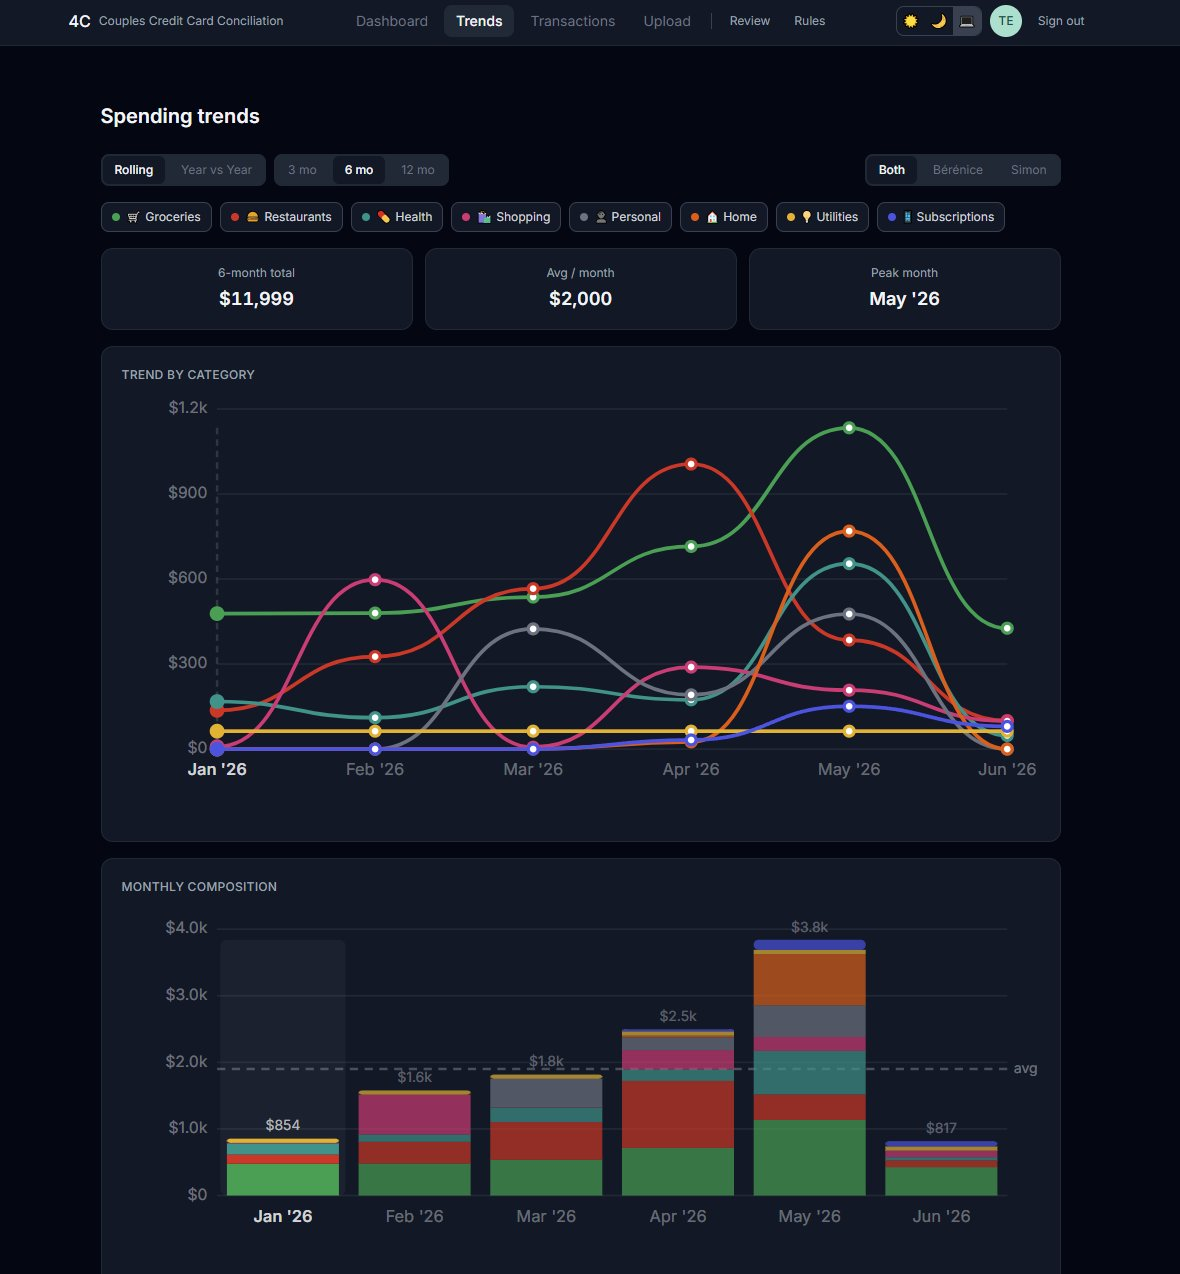
Spending trends
Once a few months of data are in, the Trends tab starts to get interesting. Category trends over time, monthly composition, rolling averages. The kind of visibility that’s hard to get when you’re just looking at a spreadsheet.
Where it stands
The core loop works end to end. Upload CSVs, review, settle up. The trends view is already showing patterns we didn’t know were there.
More features in the pipeline — but that’s for a future post. Curious about the stack? Here’s how it was built.